INTRODUCTION
Nobody knows when the World will be back to normal amid the COVID-19 pandemic, and even if we know, no one knows when we will recover from recession. There are currently some opportunities such as junk bonds with very high yields as well as companies with strong balance sheets that experienced more than 50% devaluation. However, there is always a big risk in investing all your money at once because the market may still have not reached the bottom yet and you can never be sure of when the trend will start moving upward. Two powerful ways to mitigate this risk are Time Diversification and Dollar Cost Averaging.
TIME DIVERSIFICATION
Time Diversification involves investing your money across different times. The rationale behind this strategy is that no one can time the market; accordingly utilizing this strategy protects the investor from getting stuck with a portfolio of assets bought at very expensive (possibly too expensive to recover) prices.
DOLLAR COST AVERAGING
Dollar Cost Averaging can be illustrated by the following example. Assuming your strategic asset allocation is 50% stocks and 50% bonds, and you are investing $5,000 every month, then every month you will buy $2,500 worth of stocks and $2,500 worth of bonds. This is equivalent to smoothly riding the wave of fluctuating prices and avoiding the fatal mistake of trying to time the market.
…We are in times of high uncertainties and lots of opportunities!
EXAMPLES OF LONG-TERM SHARP DECLINES
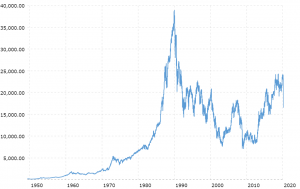
Japan Nikkei 225 Index
The below graph shows the historical trend of the Nikkei 225 Index taken from
https://www.macrotrends.net/2593/nikkei-225-index-historical-chart-data.

As you can see if you had invested all your money in 1990 while the index was peaking at about 38,274 or even right after a 35% sharp decline to the index when it reached about 25,000, you would not have recovered your investment till now! On the other hand, using Time Diversification & Dollar Cost Averaging would have minimized loses on the short term and allowed for full recovery on the long term.
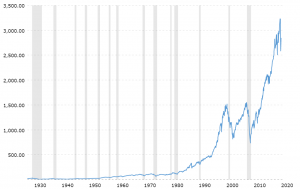
S&P 500 Index
The below graph shows the historical trend of the S&P 500 Index taken from
https://www.macrotrends.net/2324/sp-500-historical-chart-data; grey color indicates times of recession.

While the S&P 500 index has not experienced such long term decline as Japan Nikkei 225 index, it took about 25 years for the index to recover from the sharp decline that happened in 1929 at the start of the Great Depression. Again using Time Diversification & Dollar Cost Averaging would have allowed for a smooth ride as the index reached an all-time minimum at 1932.
If you think it is highly unlikely for such a trend to happen again, please see Ray Dalio interview https://www.youtube.com/watch?v=yDOAxGYG4rQ where he mentions similarities between the current situation and 1930-1945 period.
CONCLUSION
We are in times of high uncertainties and lots of opportunities. In addition to following best practices in investing such as proper diversification among asset classes, it is important to utilize time diversification and Dollar Cost Averaging because they protect against sharp long-term market declines which no one knows when and where they are going to happen.

